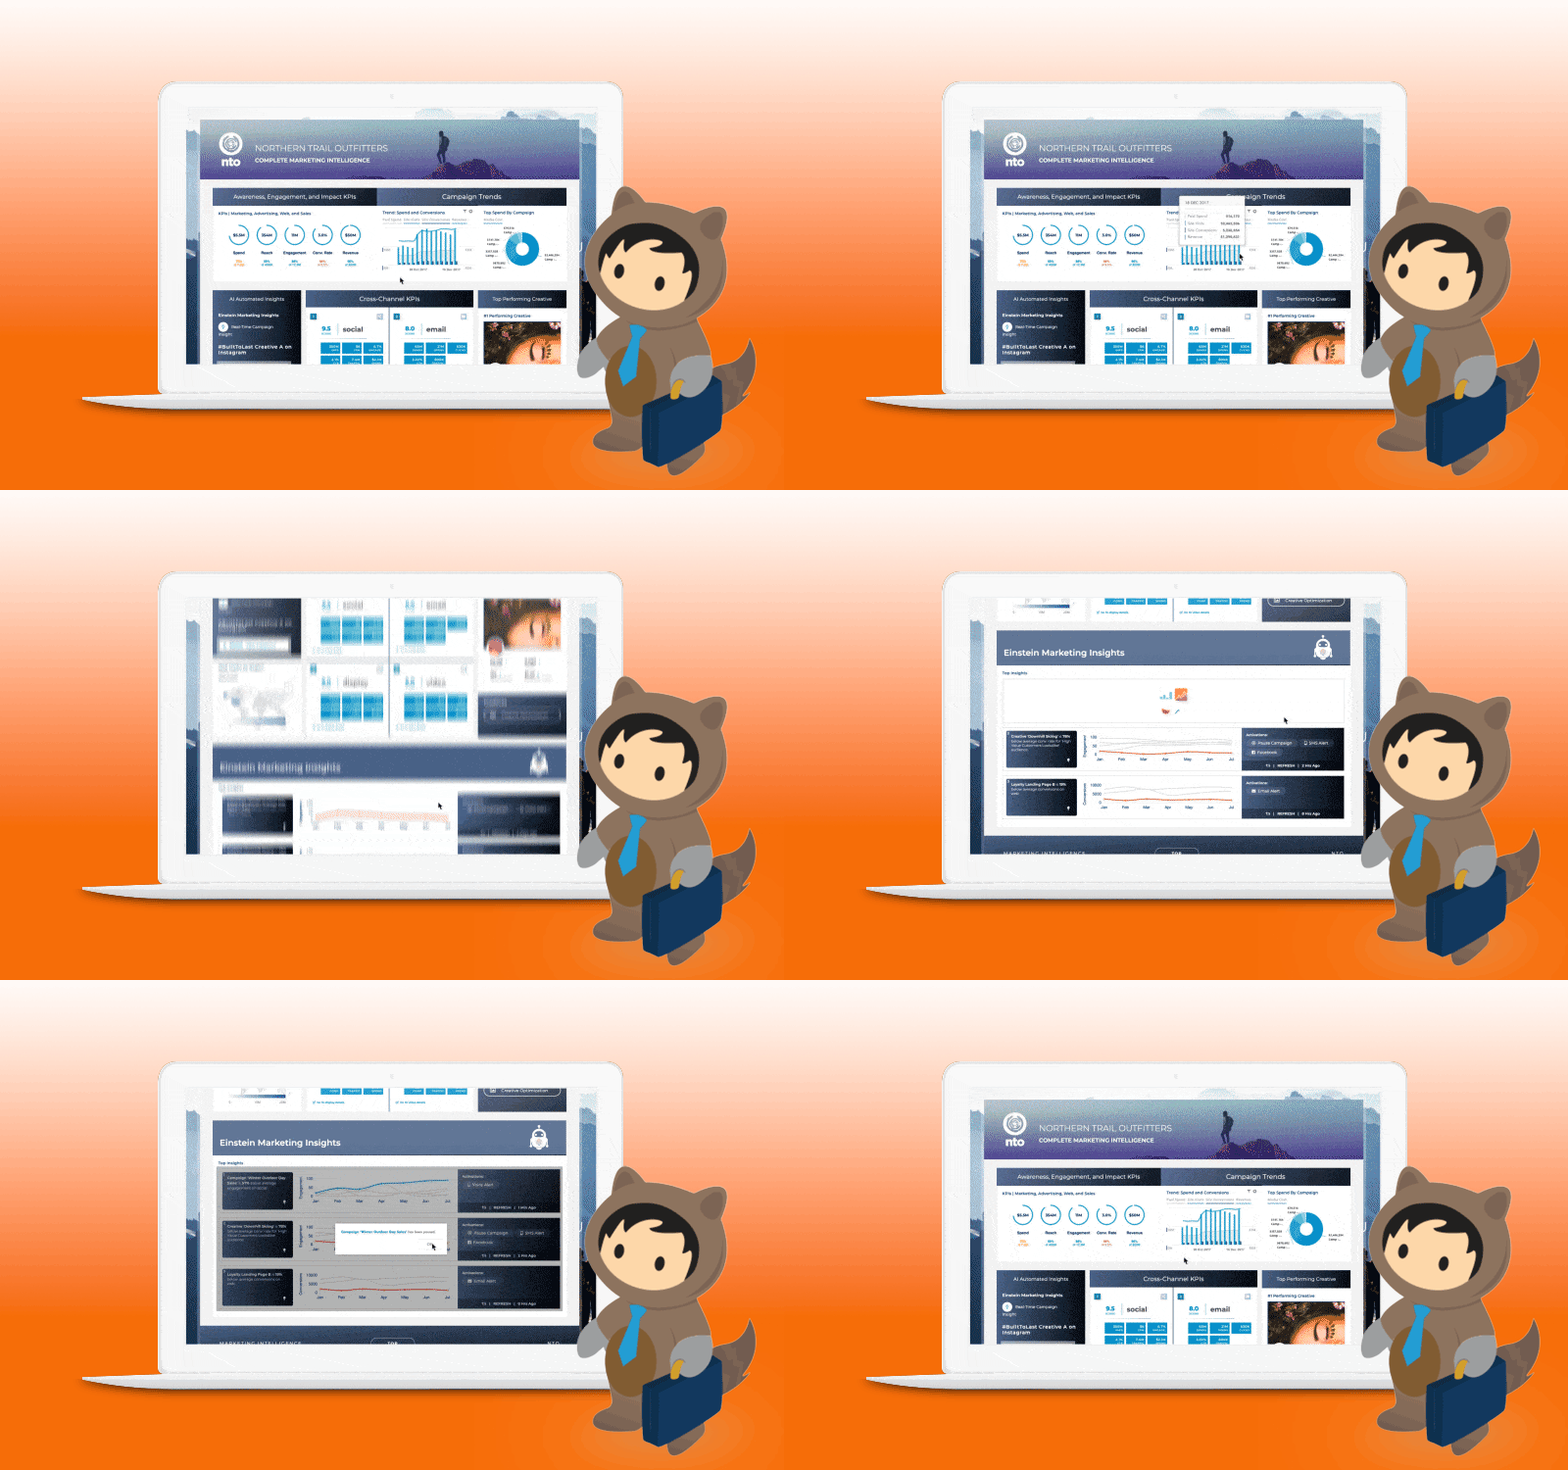
Datorama powered insights or reporting in SFMC. Which is right for you?
Salesforce Marketing Cloud Intelligence (formerly known as Datorama) is a standalone platform where you can collect your marketing data from all different sources in one place. It was created by and for marketers to collect, analyse and leverage all their data from one place, using clicks, not code.
If you work with an extensive MarTech stack, and lots of different data sources using different metrics, you will need to process and cleanse this data. Marketing Cloud Intelligence can do that for you without complex programming, saving you time and effort. All your data will be stored in one location, harmonised and ready to use.
Gather insights, share them in an attractive and easy way with widgets and dashboards, and use these insights for your business goals. Knowing how and where to leverage your data in the most efficient way, allows you to make the most of your marketing budget.
The platform’s AI-powered technology for data-integration lets you organize your data dynamically into KPIs, metrics and classifications. You can create and share attractive dashboards and widgets to visualise the collected data. Developers can create custom API connections, build custom apps for KPI measuring on top of the platform and utilize the Platform or the Query API tool.
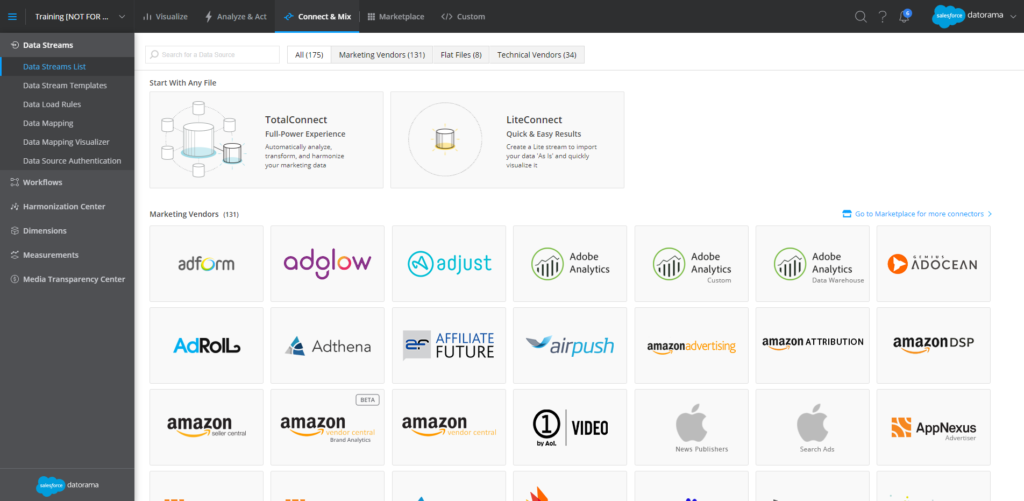
The Marketing Cloud Intelligence platform uses a customized data model to standardise and unify data from each source you connect. It features over 300 prebuilt API connectors to connect your entire ecosystem of marketing data. There’s also the TotalConnect connector which allows direct file upload, SFTP, direct upload and the option to connect to a custom query service.
You organize Salesforce Marketing Cloud Intelligence platform into workspaces. According to your use case you can dedicate a workspace to a business unit, or a customer, for example. The platform interface consists of four main tabs, Connect & mix, Analyze & Act, Visualize and Marketplace. This video explains what you can do in each tab.
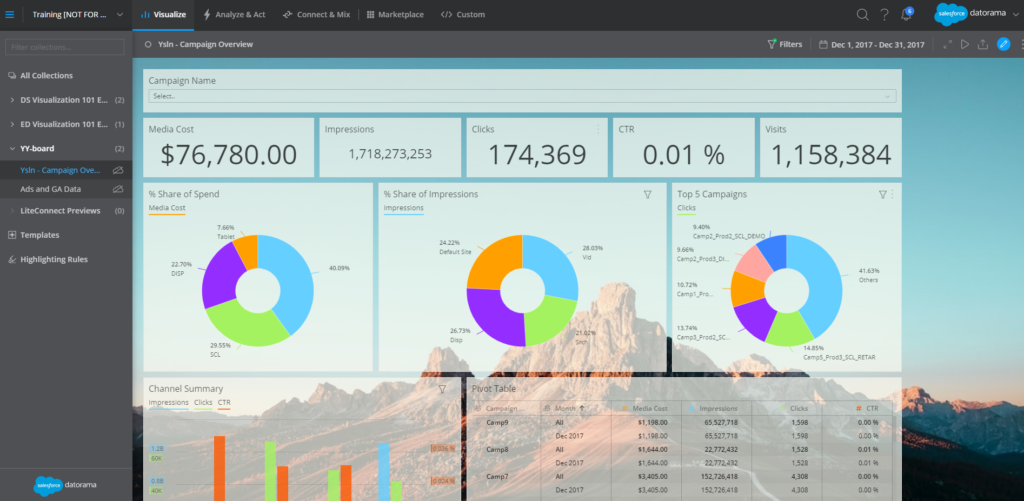
Salesforce Marketing Cloud Intelligence allows you to create, maintain and share custom dashboards to visualise your data. To enhance this visualization even further, it comes with InstaBrand. This tool makes it easy to match charts and metrics on your dashboards to your company’s or customer’s corporate style, by adding a logo and customizing colours and backgrounds.
Marketing Cloud Intelligence in Marketing Cloud: Inteligence Reports and Intelligence Reports Advanced
As a platform, Marketing Cloud Intelligence might be beyond your scope or budget. But the good news is that, since acquiring Datorama (now renamed Marketing Cloud Intelligence) in 2018, Salesforce has been working on adding some of its key functionalities to Marketing Cloud.
By integrating a number of components of Marketing Cloud Intelligence/Datorama into the Messaging & Journeys platform, Salesforce has enhanced Marketing Cloud’s toolkit for reporting, providing you with more advanced and flexible dashboards and analytics.
Intelligence Reports, standard in Marketing Cloud
The standard version of Intelligence Reports is free with Marketing Cloud Pro editions and higher. You will find it under the Analytics Builder tab, where it has replaced Discover Reporting.
Dashboards, Pivot Tables and Reports
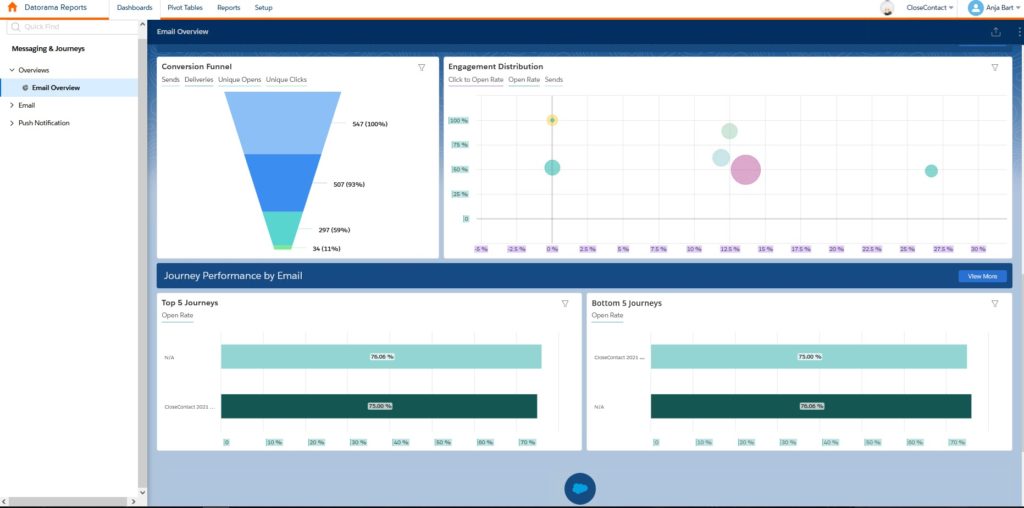
Out-of-the box dashboards provide an attractive way to visualize and share your data. You get an instant overview of your Email, Push, and Journey data so you can quickly identify trends or anomalies. Use filters for Send Date, Business Unit, Campaign, Email Name, Email Subject, Journey Name, Mobile App, Mobile OS, Push Send Name and more to dig deeper. Dashboards and individual dashboard widgets are easy to share outside Marketing Cloud, for instance by email or in Slack.
Flexible and custom Pivot tables are where you calculate, summarize, and analyze data and see comparisons, patterns, and trends, based on the available data. Pivot tables make it easy to create custom reports, without the need for SQL queries. There are five out-of-the-box pivot tables you can use.
- Email Daily Send Summary
- Best Performing Send Day
- Audience Engagement Over Time
- Campaign Performance
- Journey Performance
You can also create and customize your own pivot tables in the Pivot Table options.
Reports are how you retrieve, view, and share a detailed analysis of your data. A flat table report extracts your raw data into a CSV or Excel file with different tabs. You can select a pivot table report to export a pivot table to a scheduled report. You can also create a dashboard report by exporting a dashboard page. Reports can be delivered in various ways: AzureBlob, Email, FTPS, Google Drive, HDFS, SFTP, AWS – S3 and Google Cloud Storage are all supported delivery methods.
Get extras with Intelligence Reports Advanced
Available with Marketing Cloud at additional cost, Intelligence Reports Advanced offers even more. It has all the standard functionalities that Intelligence Reports has, but it allows you to go a step further and add different customizable aspects for your specific business needs.
You can create your own dashboards and customize them with InstaBrand, so you can impress stakeholders with branded dashboards and reports. But that’s not all: In Intelligence Reports Advanced you can create and manage custom Calculated measurements and Dimensions, query granular data (using the no-code Query Builder or SQL) and view and install cross-channel apps. This way, Pivot Tables can be customized even further with data beyond what is standard available. You can also delete contacts to comply with privacy legislation (the data will still be available for analysis and reporting, but anonymised).
Not sure if Marketing Cloud Intelligence or Intelligence Reports in Marketing Cloud fits your business needs? CloseContact is certified for Salesforce Marketing Intelligence and an experienced consultant for Marketing Cloud. We can help you find out what is the best fit for your business goals. Contact us for more information by clicking the button below.
